
Stage 4 of 5 · Intelligence
Information people actually use.
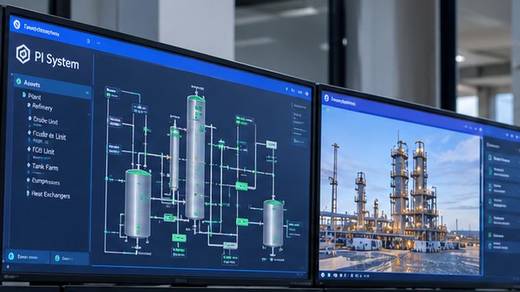
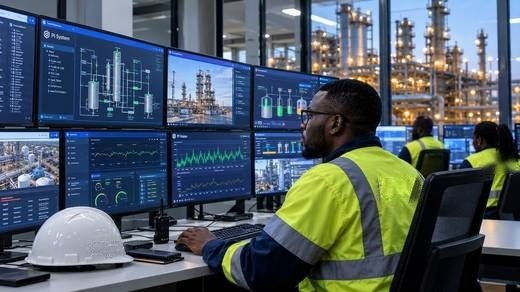
Data only creates value when the right people can see it clearly. We build PI Vision displays, dashboards and analytics designed around how operators, engineers and managers work.
- AVEVA Select Partner
- IEC 62443
- ISA-18.2
- Cyber Security Act, 2020
Intelligence
What we do
- PI Vision displays and dashboards
- Operational KPIs
- Event frames and analytics
- Reporting for performance, energy and reliability
Relevant industries
The operating data path
Where this stage fits
Each stage builds on the one before it. Select a stage to explore it.
05 Decision
Better decisions at every level.
Operators respond sooner, engineers find root causes faster, and leadership sees performance across sites with confidence in the numbers.
- Operators
- Engineers
- Leadership
People
04 Intelligence
Information people actually use.
Data only creates value when the right people can see it clearly.
- PI Vision
- Dashboards
- Operational analytics
Level 4
OT security separates the plant network from the enterprise network and protects the data path between them.
- Firewall
- DMZ
- IEC 62443
Level 3.5
Enterprise networkOT networkOne trusted record of the operation.
The AVEVA PI System collects high-fidelity, time-series data from across your control systems and stores it as a single, reliable history.
- PI System historian
- Asset Framework
- Data quality
Level 3
Reliable control at the plant floor.
PLCs, DCS, SCADA and HMIs run the process minute by minute.
- PLC / DCS
- SCADA
- HMI
Levels 1–2
01 Plant
Where operational data begins.
Every pump, mill, turbine and line generates signals about how the operation is performing.
- Machines
- Equipment
- Sensors
Level 0
Outputs
What people see
- 01PI Vision displaysWeb-based displays built on Asset Framework.
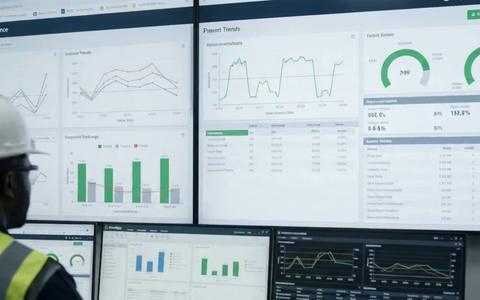
- 02Operational KPIsFor example availability, OEE, energy per unit produced and mean time between failures.
- 03NotificationsAlerts when a condition or event needs attention.
- 04ReportsShift, daily and monthly performance and reliability reporting.
Outcome
Faster understanding of what is happening, and why.
Related capabilitiesPI System & industrial data
